45% EPS CAGR, 29% ROE: What’s driving Solar Industries’ growth?
A Rs 21,200 crore order book, the commercial rollout of Pinaka rockets, and rapidly scaling international defence orders are transforming Solar Industries from an industrial explosives maker into one of India’s fastest-growing defence manufacturers. Investors are now watching whether this momentum can sustain the company’s next phase of compounding.
Solar Industries makes industrial explosives used in mining and infrastructure projects. Over the last few years, however, the company has quietly transformed itself into something much larger: a serious defence manufacturing player with growing international exposure.
Between FY21 and FY25, earnings per share (EPS) grew from Rs 31.9 to Rs 142.5, a CAGR of roughly 45%. During the same period, Return on Equity (ROE) improved from 18% to 29%. High growth and high capital efficiency sustained over five years.
The stock price reflects that rate of change.
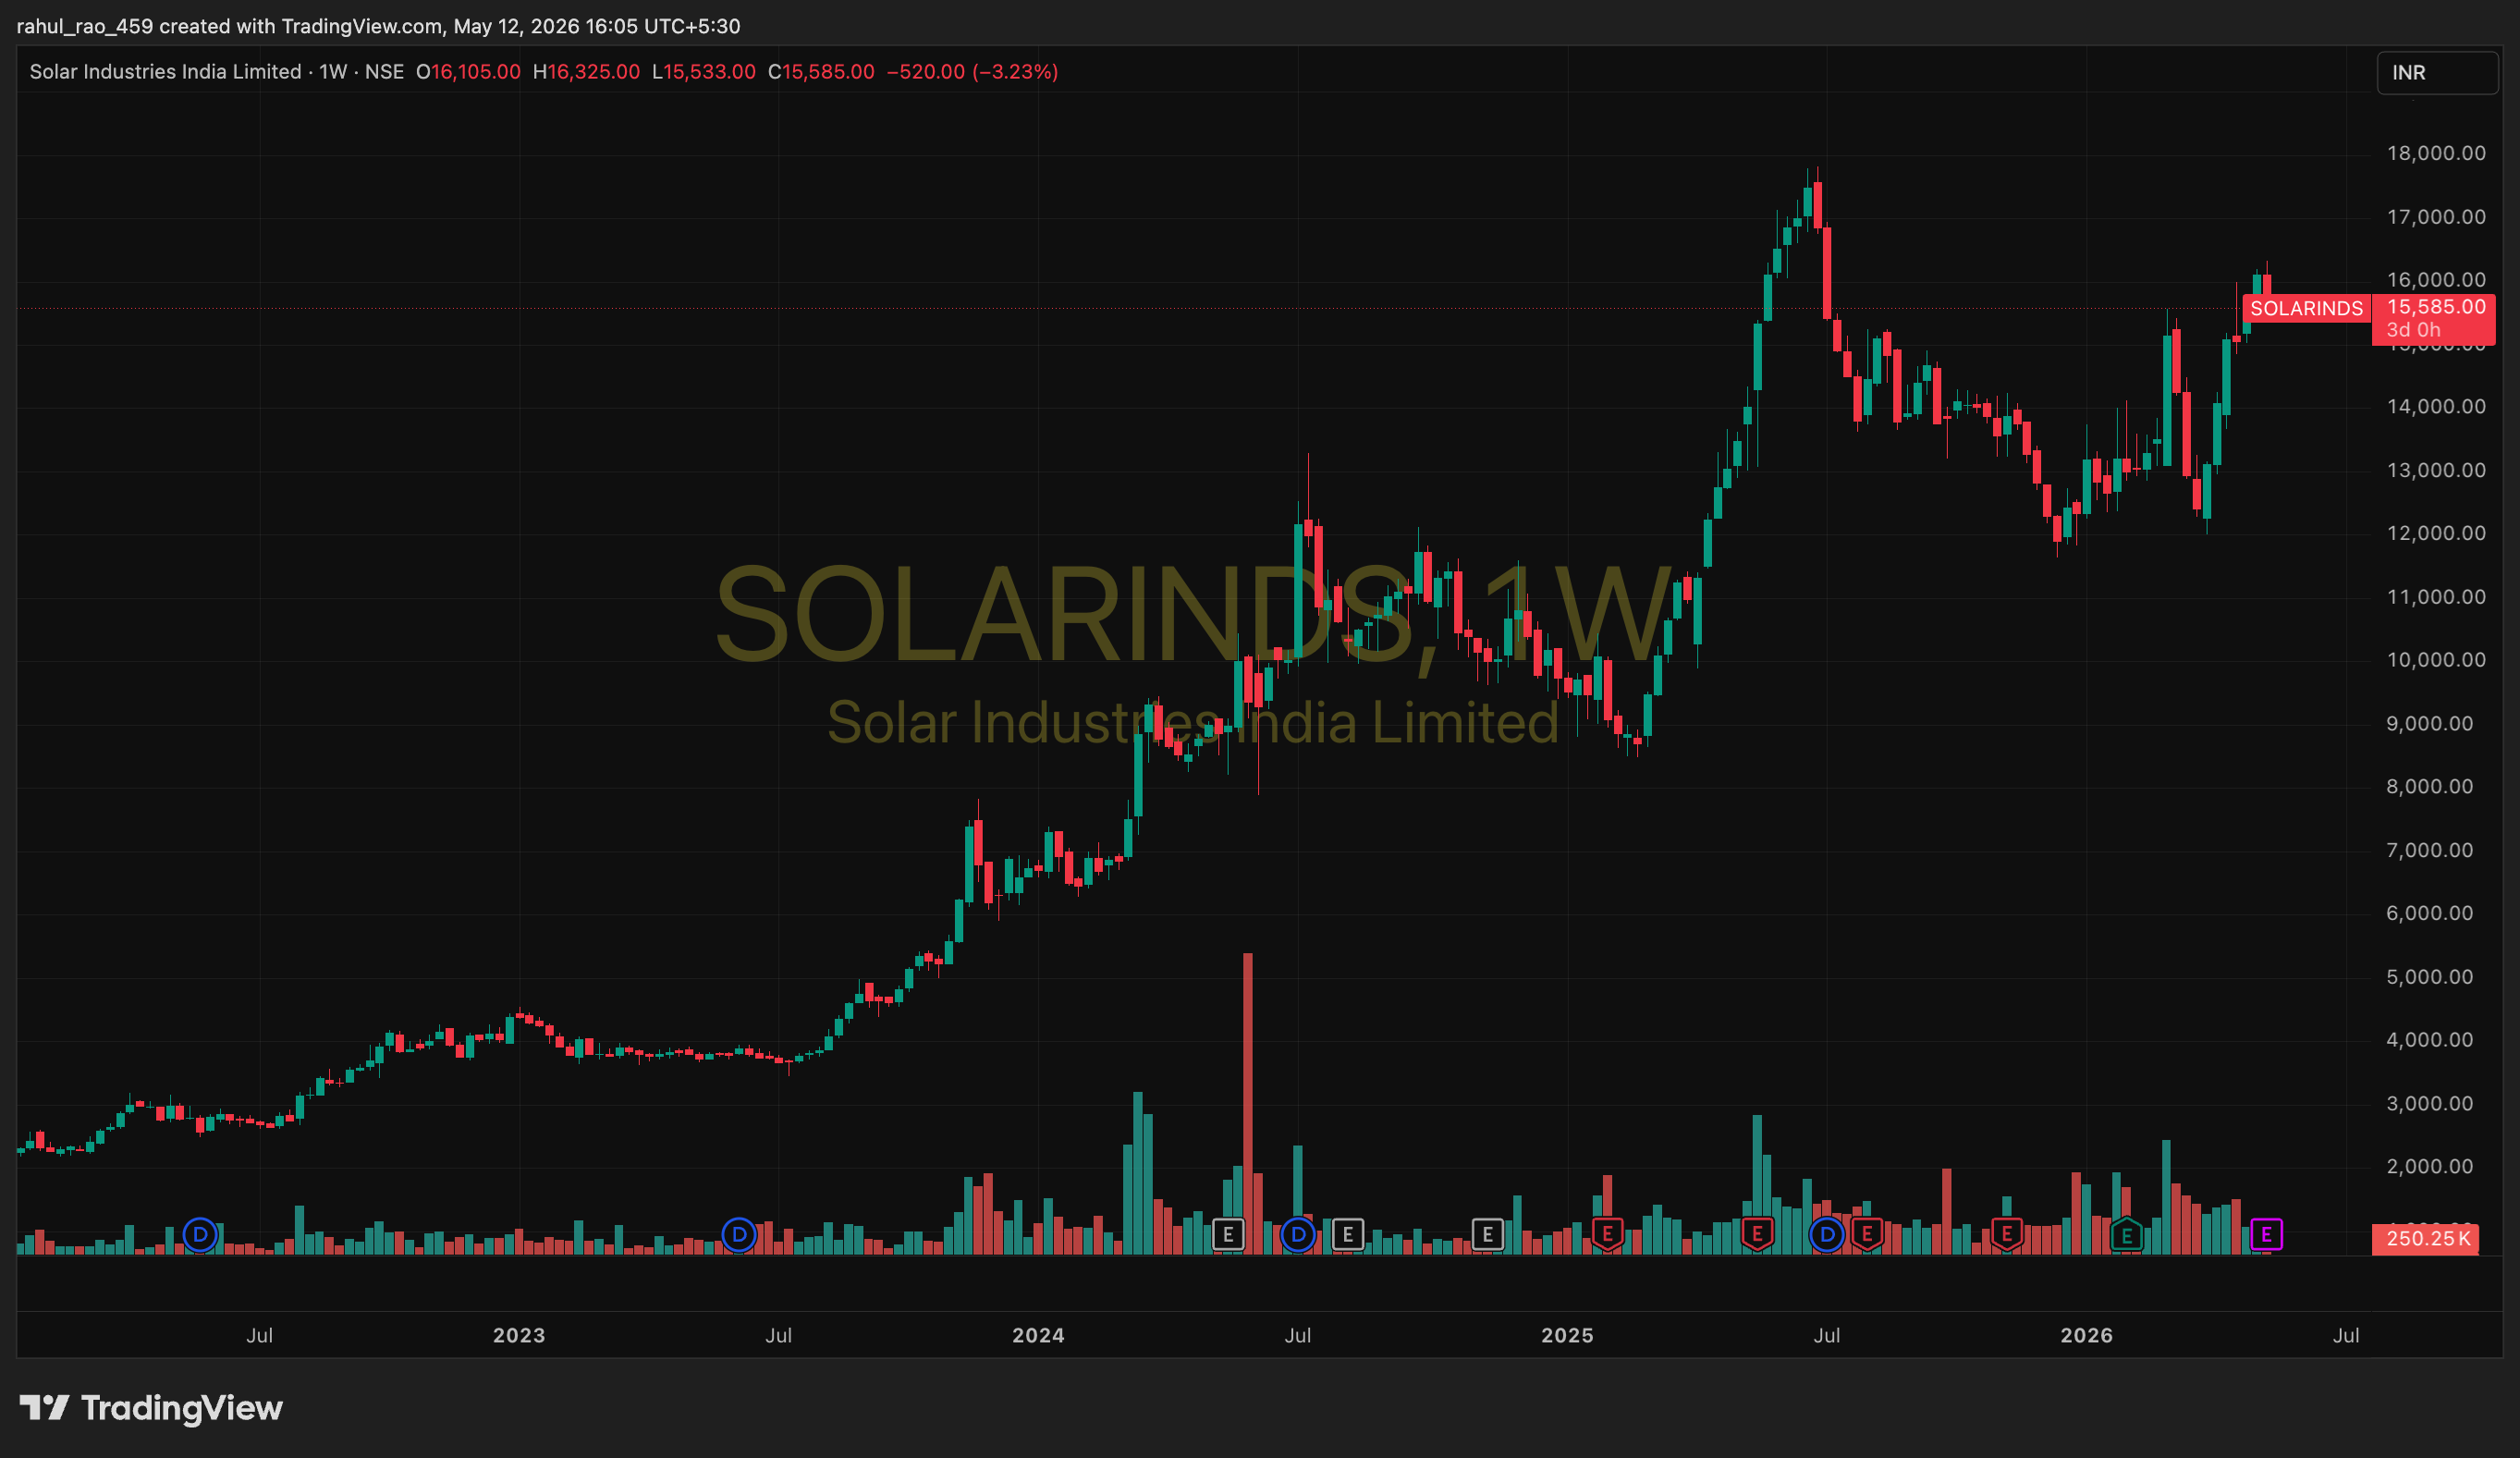
Source: http://www.tradingview.com
While EBITDA margin touched an all-time high of 28.77% in the December 2025 quarter, revenue growth slowed to 29%. That could simply be a temporary pause.
Meanwhile, the company’s order book has crossed Rs 21,200 crore, roughly 2.8 times FY25 revenue, and CRISIL revised its outlook on the company to ‘Positive’ in April 2026.
But there is an important question investors must ask.
Can a 45% EPS growth rate continue?
The next phase of growth will depend on three things: order book conversion, the commercial launch of the Pinaka rocket programme, and the international defence ramp.
What Solar Industries actually does
Solar Industries operates across two distinct businesses:
1) Industrial explosives for mining and infrastructure
2) Military explosives, ammunition, rockets, and drones for defence
The chemistry overlaps. The customers do not.
Mining clients prioritise reliability and cost efficiency. Defence customers prioritise performance, secrecy, and supplier relationships that can survive a decade of trials before the first commercial order.
In 9M FY26, the revenue mix increasingly tilted toward international and defence business segments.
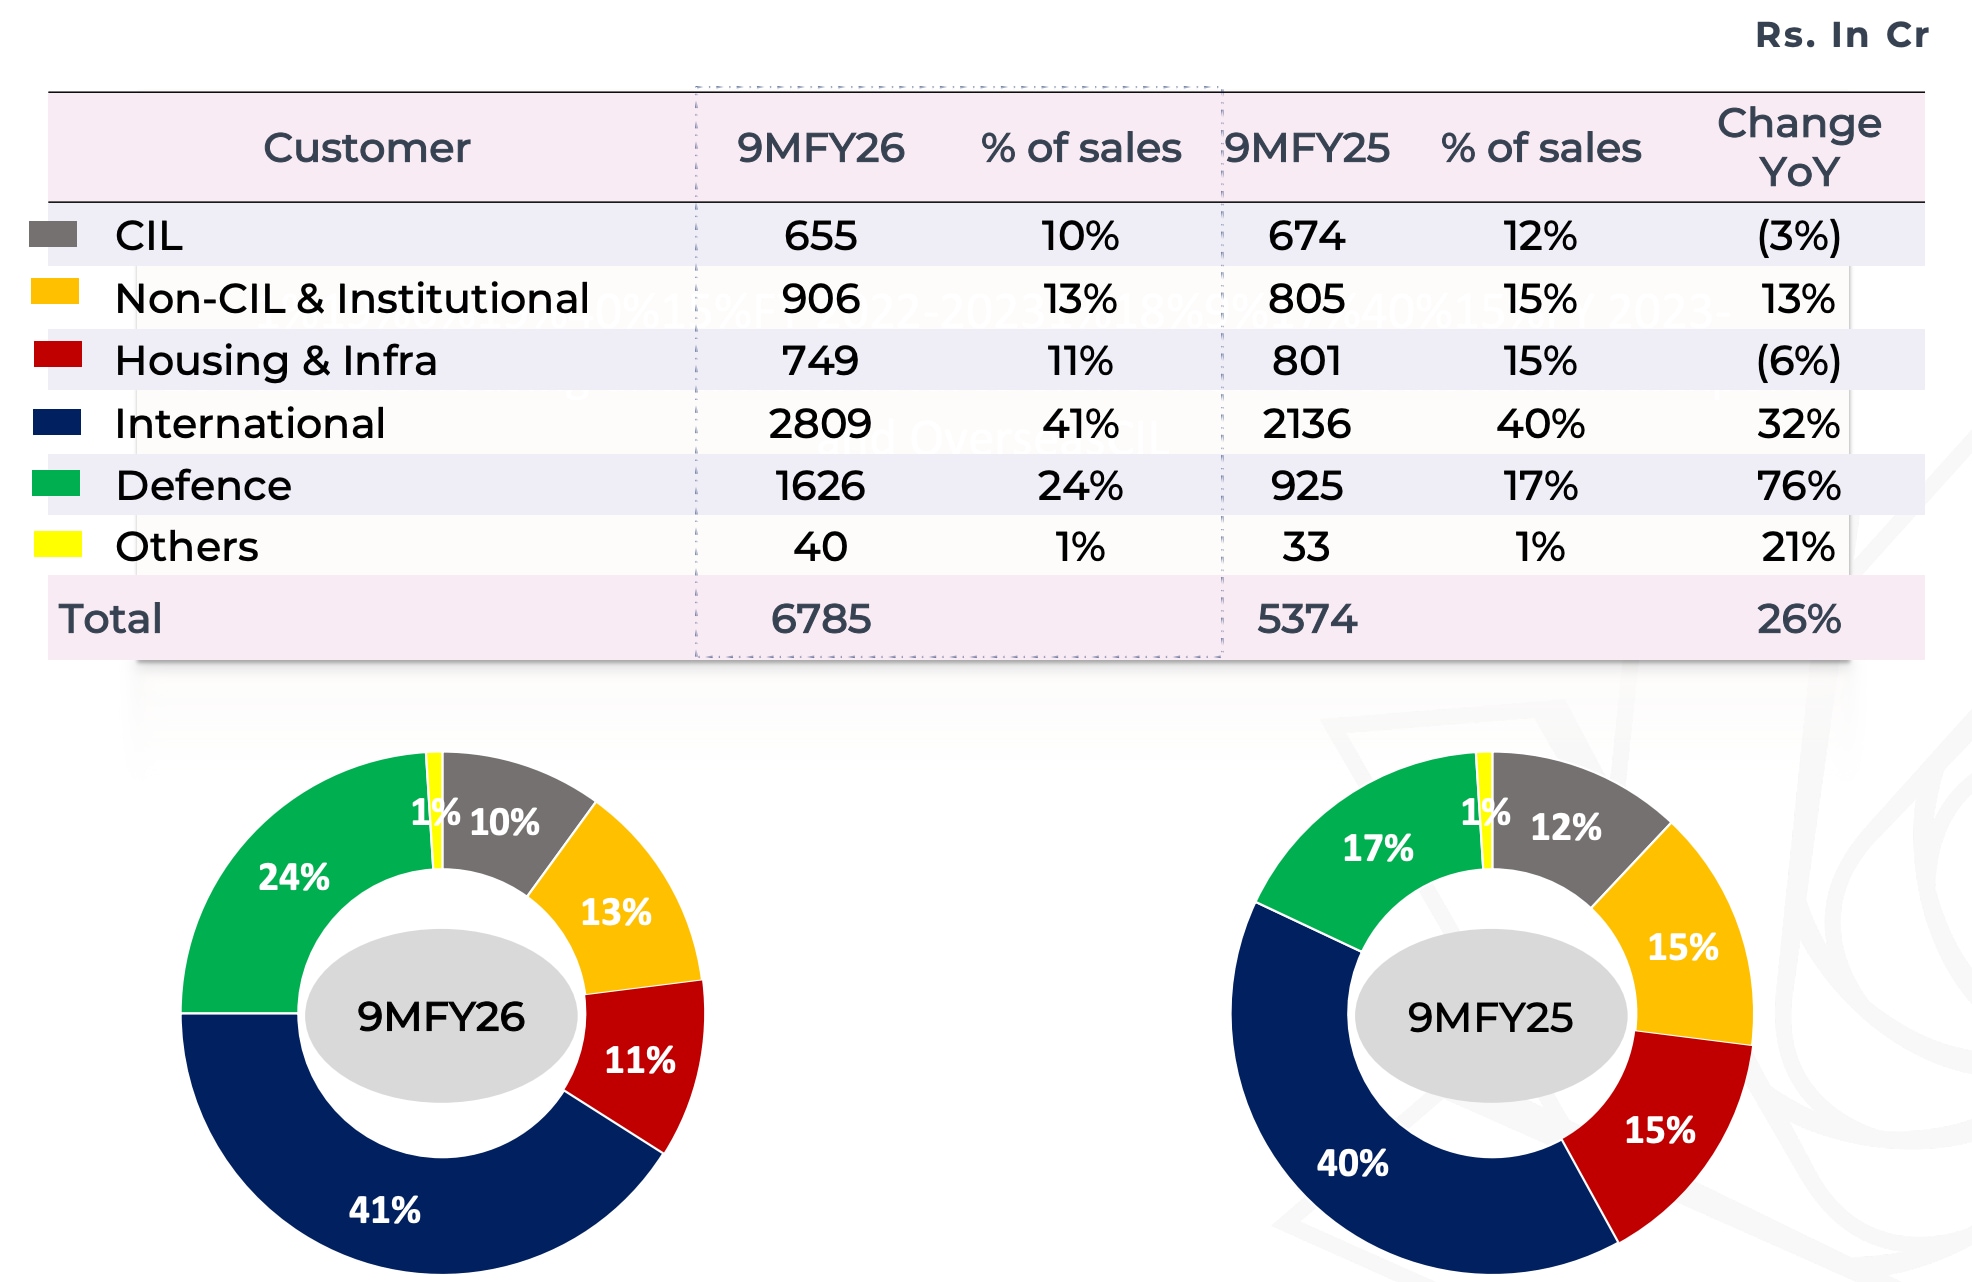
Source: Solar Industries Q3FY26 Investor presentation
Solar Industries possesses competitive advantages that are difficult to replicate.
Explosives manufacturing requires years of regulatory approvals and highly restricted plant locations. Defence manufacturing involves qualification cycles that can stretch 7-10 years before commercial orders begin. The company is also heavily backward integrated across key raw materials, which strengthens margins and supply-chain control.
Its Nagpur facility is considered the world’s largest single-location explosives plant. Beyond that, Solar operates 32 plants in India and 10 overseas facilities across countries such as Turkiye, Nigeria, South Africa, Zambia, and Indonesia.
The compounding scorecard
Here is the five-year track record, plus where management expects FY26 to land:
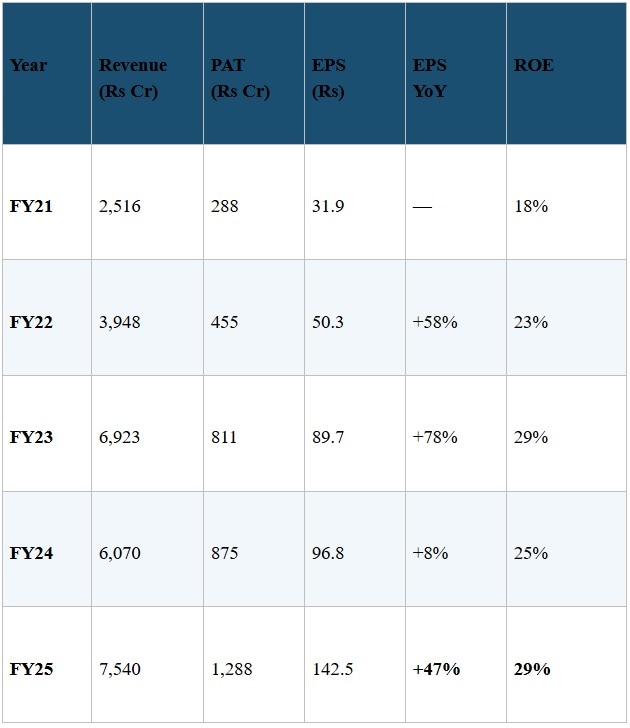
Source: Solar AR FY25 Financial Capital section; CRISIL April 23, 2026 rating rationale. FY26E are author estimates
Two things stand out. The 45 % EPS CAGR was not driven by one big year.
It was 58% in FY22, 78% in FY23, 8% in FY24 as ammonium nitrate prices reset, and 47% in FY25 as defence began to scale. ROE remained between 23% and 29% band throughout, suggesting the company did not rely on aggressive leverage to drive earnings growth.
How did Solar Industries achieve this? Three things:
Here’s what can support high growth rates in the next phase of growth.
Lever 1: A massive order book
As of December 31, 2025, Solar Industries’ order book stood at over Rs 21,200 crore. Of this, around Rs 18,000 crore comes from defence orders, while roughly Rs 3,200 crore comes from industrial explosives, mining, and infrastructure.
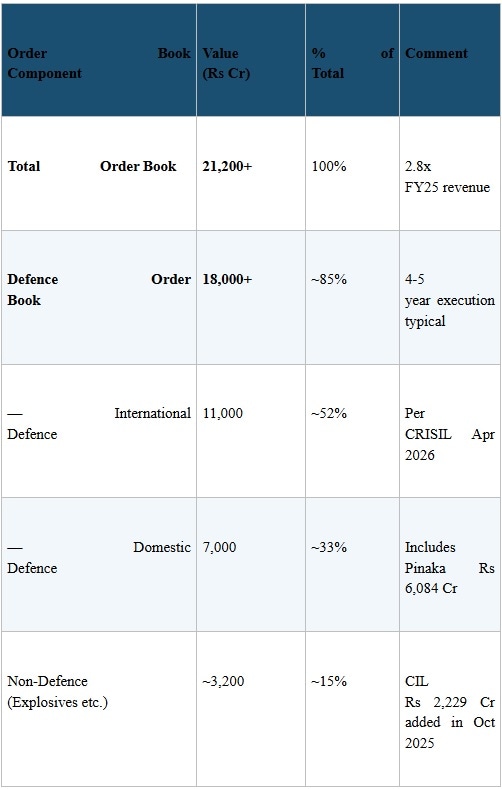
Source: Solar Q3 FY26 IP and Concall (Feb 4, 2026); CRISIL Rating Rationale, April 23, 2026
The defence order book alone implies annual revenue visibility of roughly Rs 4,000-4,500 crore over the next four to five years.
Management has guided for approximately Rs 3,000 crore of defence revenue in FY26. The current order pipeline suggests that defence revenue could increase by 40-50% in FY28.
Importantly, the order book continues to expand.
During the December 2025 quarter alone, the company added Rs 2,500 crore of new defence orders. In October 2025, Solar Industries also secured over Rs 2,229 crore of orders from Coal India Limited.
Lever 2: Pinaka could change the earnings profile
In Q4 FY25, Solar Industries received its largest-ever defence order: A Rs 6,084 crore contract from the Ministry of Defence linked to the Pinaka rocket system.
What many investors may be missing is this: The Rs 1,626 crore of defence revenue reported during 9M FY26 included virtually no contribution from Pinaka.
Commercial dispatches only began during the January-March 2026 quarter.
That matters because management has reaffirmed FY26 defence revenue guidance of Rs 3,000 crore. To achieve that number, Q4 defence revenue would need to rise sharply from Q3 levels.
If the Pinaka ramp-up executes smoothly, FY26 EPS could move meaningfully higher. If execution slips by a quarter, earnings may simply shift into FY27.
Either way, the order is in the bag. Only the timing carries risk.
Lever 3: International defence, the story nobody is telling
The market has focused heavily on the Pinaka contract. But the larger long-term opportunity may actually be international defence.
The numbers tell the story.
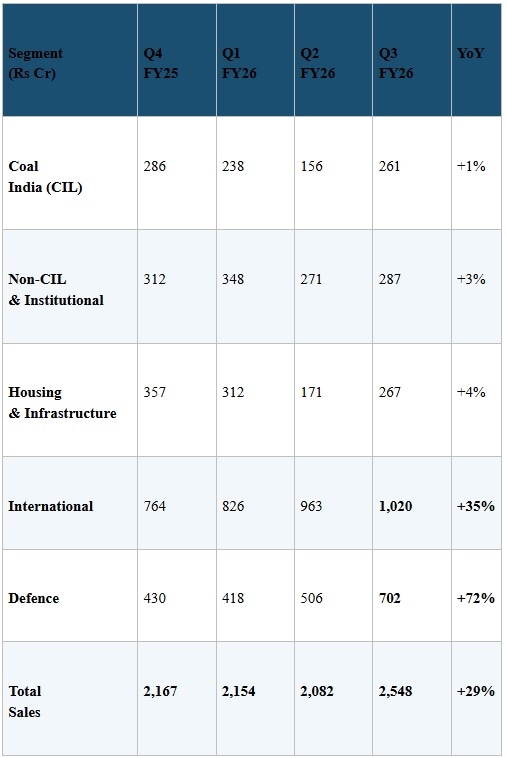
Source: Solar Industries Investor Presentations Q4 FY25 to Q3 FY26
Of the Rs 18,000 crore defence order book, nearly Rs 11,000 crore comes from international orders. That is more than 60% of the defence pipeline.
International revenue crossed Rs 1,000 crore in a single quarter for the first time in Q3 FY26, 9M FY26 international revenue grew 32% YoY to Rs 2,809 crore, and international business now contributes roughly 41% of total sales.
Operations in South Africa have turned profitable. Saudi Arabia expansion plans are underway. Australia and Indonesia are scaling.
This matters because international defence and specialised explosives generally carry better margins than standard industrial explosives. That mix shift is one reason EBITDA margins have remained elevated even during periods of heavy capacity expansion.
Management’s growth outlook
During the Q3 FY26 earnings call, management sounded unusually confident about the medium-term growth trajectory.
On revenue growth, management stated that achieving 20%+ consolidated growth over the next 3-5 years “is not at all difficult” at the current stage.
On margins, management indicated confidence in sustaining EBITDA margins in the 27-28% range over the next several years.
So is the stock pricing this in?
Solar Industries currently trades at roughly Rs 15,000 per share, has a market cap of roughly Rs 1,41,000 crore, around 97x trailing earnings, and approximately 26x book value. The 52-week range has been Rs 13,200-17,820.
Solar Industries PE ratio historical chart
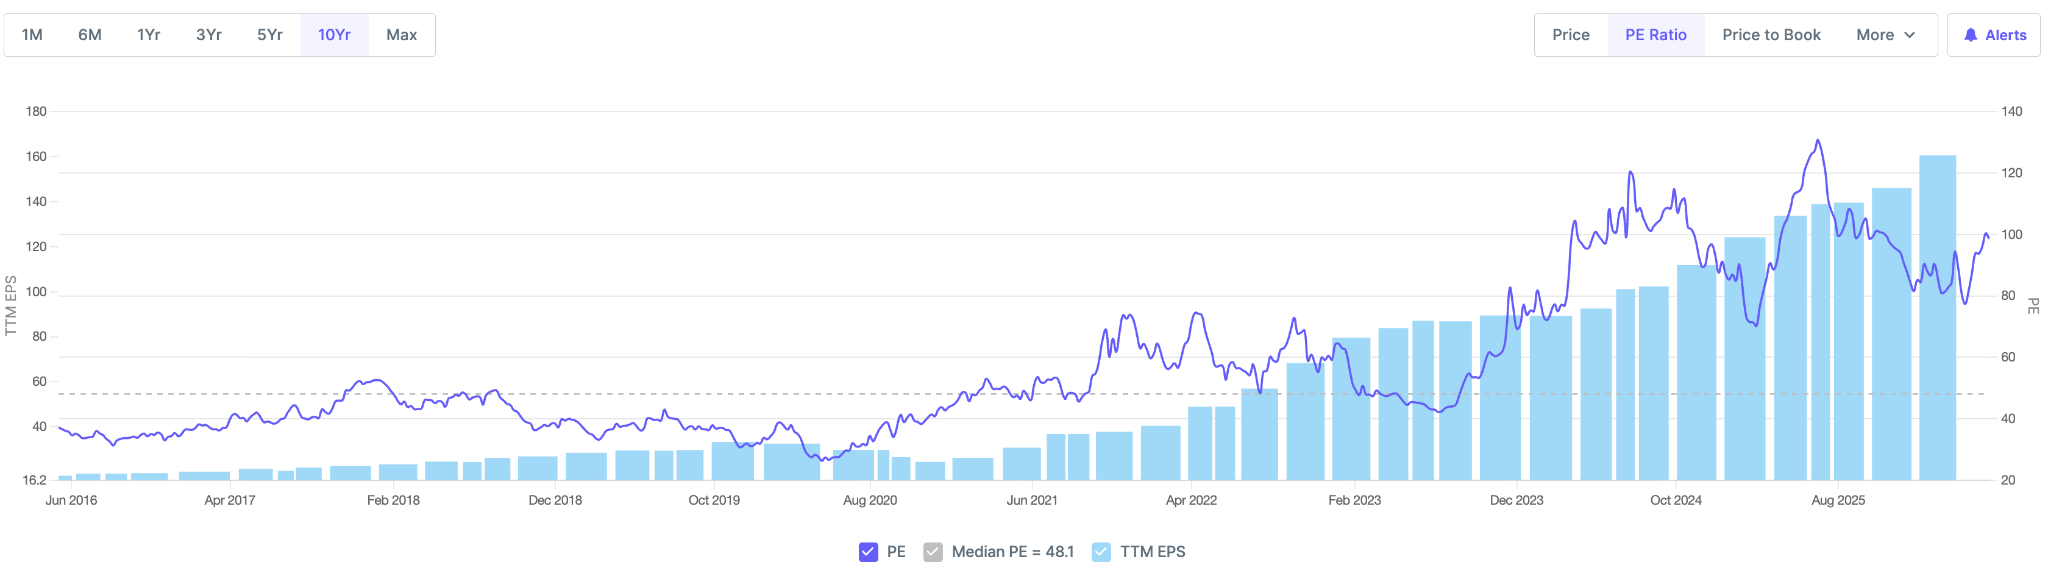
Source: http://www.screener.in
Even EV/EBITDA is nearly 60x, above its long-term median value but below its recent peak of 78x.
Solar Industries EV/EBITDA historical chart
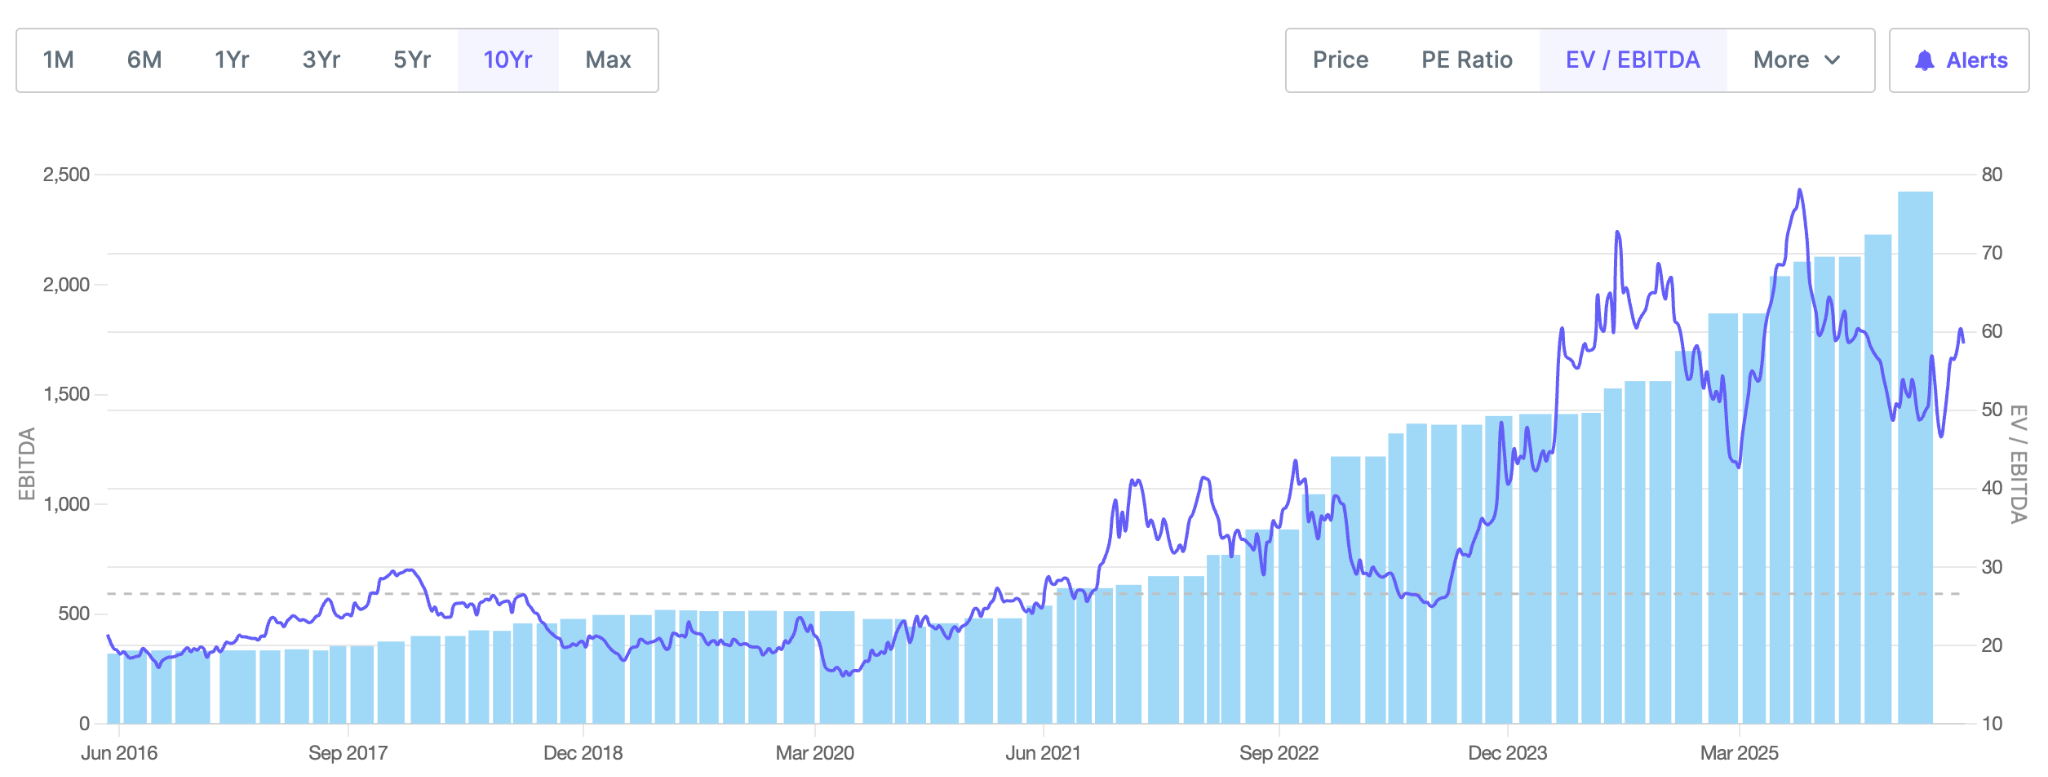
Source: http://www.screener.in
But Solar Industries is not a conventional industrial company anymore.
The aerospace and defence sector’s P/E averages around 61 times. Solar Industries’ premium reflects its capital efficiency (ROE 29% versus sector’s 12-18%) and its export-led growth profile.
Solar Industries trades at a premium compared with peers like Bharat Electronics Ltd and Hindustan Aeronautics Ltd, but they carry lower ROE and slower historical EPS growth.
In such cases, the forward math is more useful. If EPS in FY28 reaches Rs 250 as the order book executes, the current price implies a forward P/E of about 60 times on FY28 earnings. It is still expensive, but for a company growing earnings at 30%+ with Rs 21,200 crore of order book visibility and a ROE above 25%+, conventional valuation metrics may not apply.
Disclaimer: Please note these are if-then estimates and may be subject to error.
What investors need to see is Pinaka dispatches scaling cleanly, international defence orders growing at 30%+, EBITDA margin holding above 25%, and incremental capex generating returns that keep ROE above 25%. If those four hold, the next leg of compounding is likely intact.
If those conditions hold, the next leg of compounding will likely be intact.
The order book already suggests that the second phase could be bigger than the first. The real debate now is whether the market has fully priced that in.
Note: We have relied on data from http://www.Screener.in and http://www.tijorifinance.com throughout this article. Only in cases where the data was not available, have we used an alternate, but widely used and accepted source of information.
Rahul Rao has helped conduct financial literacy programmes for over 1,50,000 investors. He has also worked at an AIF, focusing on small and mid-cap opportunities.
Disclosure: The writer or his dependents do not hold shares in the securities/stocks/bonds discussed in the article.
The website managers, its employee(s), and contributors/writers/authors of articles have or may have an outstanding buy or sell position or holding in the securities, options on securities or other related investments of issuers and/or companies discussed therein. The content of the articles and the interpretation of data are solely the personal views of the contributors/writers/authors. Investors must make their own investment decisions based on their specific objectives, resources and only after consulting such independent advisors as may be necessary.
Solar Industries makes industrial explosives used in mining and infrastructure projects. Over the last few years, however, the company has quietly transformed itself into something much larger: a serious defence manufacturing player with growing international exposure.
Between FY21 and FY25, earnings per share (EPS) grew from Rs 31.9 to Rs 142.5, a CAGR of roughly 45%. During the same period, Return on Equity (ROE) improved from 18% to 29%. High growth and high capital efficiency sustained over five years.
The stock price reflects that rate of change.
Source: http://www.tradingview.com
While EBITDA margin touched an all-time high of 28.77% in the December 2025 quarter, revenue growth slowed to 29%. That could simply be a temporary pause.
Meanwhile, the company’s order book has crossed Rs 21,200 crore, roughly 2.8 times FY25 revenue, and CRISIL revised its outlook on the company to ‘Positive’ in April 2026.
But there is an important question investors must ask.
Can a 45% EPS growth rate continue?
The next phase of growth will depend on three things: order book conversion, the commercial launch of the Pinaka rocket programme, and the international defence ramp.
What Solar Industries actually does
Solar Industries operates across two distinct businesses:
1) Industrial explosives for mining and infrastructure
2) Military explosives, ammunition, rockets, and drones for defence
The chemistry overlaps. The customers do not.
Mining clients prioritise reliability and cost efficiency. Defence customers prioritise performance, secrecy, and supplier relationships that can survive a decade of trials before the first commercial order.
In 9M FY26, the revenue mix increasingly tilted toward international and defence business segments.
Source: Solar Industries Q3FY26 Investor presentation
Solar Industries possesses competitive advantages that are difficult to replicate.
Explosives manufacturing requires years of regulatory approvals and highly restricted plant locations. Defence manufacturing involves qualification cycles that can stretch 7-10 years before commercial orders begin. The company is also heavily backward integrated across key raw materials, which strengthens margins and supply-chain control.
Its Nagpur facility is considered the world’s largest single-location explosives plant. Beyond that, Solar operates 32 plants in India and 10 overseas facilities across countries such as Turkiye, Nigeria, South Africa, Zambia, and Indonesia.
The compounding scorecard
Here is the five-year track record, plus where management expects FY26 to land:
Source: Solar AR FY25 Financial Capital section; CRISIL April 23, 2026 rating rationale. FY26E are author estimates
Two things stand out. The 45 % EPS CAGR was not driven by one big year.
It was 58% in FY22, 78% in FY23, 8% in FY24 as ammonium nitrate prices reset, and 47% in FY25 as defence began to scale. ROE remained between 23% and 29% band throughout, suggesting the company did not rely on aggressive leverage to drive earnings growth.
How did Solar Industries achieve this? Three things:
Here’s what can support high growth rates in the next phase of growth.
Lever 1: A massive order book
As of December 31, 2025, Solar Industries’ order book stood at over Rs 21,200 crore. Of this, around Rs 18,000 crore comes from defence orders, while roughly Rs 3,200 crore comes from industrial explosives, mining, and infrastructure.
Source: Solar Q3 FY26 IP and Concall (Feb 4, 2026); CRISIL Rating Rationale, April 23, 2026
The defence order book alone implies annual revenue visibility of roughly Rs 4,000-4,500 crore over the next four to five years.
Management has guided for approximately Rs 3,000 crore of defence revenue in FY26. The current order pipeline suggests that defence revenue could increase by 40-50% in FY28.
Importantly, the order book continues to expand.
During the December 2025 quarter alone, the company added Rs 2,500 crore of new defence orders. In October 2025, Solar Industries also secured over Rs 2,229 crore of orders from Coal India Limited.
Lever 2: Pinaka could change the earnings profile
In Q4 FY25, Solar Industries received its largest-ever defence order: A Rs 6,084 crore contract from the Ministry of Defence linked to the Pinaka rocket system.
What many investors may be missing is this: The Rs 1,626 crore of defence revenue reported during 9M FY26 included virtually no contribution from Pinaka.
Commercial dispatches only began during the January-March 2026 quarter.
That matters because management has reaffirmed FY26 defence revenue guidance of Rs 3,000 crore. To achieve that number, Q4 defence revenue would need to rise sharply from Q3 levels.
If the Pinaka ramp-up executes smoothly, FY26 EPS could move meaningfully higher. If execution slips by a quarter, earnings may simply shift into FY27.
Either way, the order is in the bag. Only the timing carries risk.
Lever 3: International defence, the story nobody is telling
The market has focused heavily on the Pinaka contract. But the larger long-term opportunity may actually be international defence.
The numbers tell the story.
Source: Solar Industries Investor Presentations Q4 FY25 to Q3 FY26
Of the Rs 18,000 crore defence order book, nearly Rs 11,000 crore comes from international orders. That is more than 60% of the defence pipeline.
International revenue crossed Rs 1,000 crore in a single quarter for the first time in Q3 FY26, 9M FY26 international revenue grew 32% YoY to Rs 2,809 crore, and international business now contributes roughly 41% of total sales.
Operations in South Africa have turned profitable. Saudi Arabia expansion plans are underway. Australia and Indonesia are scaling.
This matters because international defence and specialised explosives generally carry better margins than standard industrial explosives. That mix shift is one reason EBITDA margins have remained elevated even during periods of heavy capacity expansion.
Management’s growth outlook
During the Q3 FY26 earnings call, management sounded unusually confident about the medium-term growth trajectory.
On revenue growth, management stated that achieving 20%+ consolidated growth over the next 3-5 years “is not at all difficult” at the current stage.
On margins, management indicated confidence in sustaining EBITDA margins in the 27-28% range over the next several years.
So is the stock pricing this in?
Solar Industries currently trades at roughly Rs 15,000 per share, has a market cap of roughly Rs 1,41,000 crore, around 97x trailing earnings, and approximately 26x book value. The 52-week range has been Rs 13,200-17,820.
Solar Industries PE ratio historical chart
Source: http://www.screener.in
Even EV/EBITDA is nearly 60x, above its long-term median value but below its recent peak of 78x.
Solar Industries EV/EBITDA historical chart
Source: http://www.screener.in
But Solar Industries is not a conventional industrial company anymore.
The aerospace and defence sector’s P/E averages around 61 times. Solar Industries’ premium reflects its capital efficiency (ROE 29% versus sector’s 12-18%) and its export-led growth profile.
Solar Industries trades at a premium compared with peers like Bharat Electronics Ltd and Hindustan Aeronautics Ltd, but they carry lower ROE and slower historical EPS growth.
In such cases, the forward math is more useful. If EPS in FY28 reaches Rs 250 as the order book executes, the current price implies a forward P/E of about 60 times on FY28 earnings. It is still expensive, but for a company growing earnings at 30%+ with Rs 21,200 crore of order book visibility and a ROE above 25%+, conventional valuation metrics may not apply.
Disclaimer: Please note these are if-then estimates and may be subject to error.
What investors need to see is Pinaka dispatches scaling cleanly, international defence orders growing at 30%+, EBITDA margin holding above 25%, and incremental capex generating returns that keep ROE above 25%. If those four hold, the next leg of compounding is likely intact.
If those conditions hold, the next leg of compounding will likely be intact.
The order book already suggests that the second phase could be bigger than the first. The real debate now is whether the market has fully priced that in.
Note: We have relied on data from http://www.Screener.in and http://www.tijorifinance.com throughout this article. Only in cases where the data was not available, have we used an alternate, but widely used and accepted source of information.
Rahul Rao has helped conduct financial literacy programmes for over 1,50,000 investors. He has also worked at an AIF, focusing on small and mid-cap opportunities.
Disclosure: The writer or his dependents do not hold shares in the securities/stocks/bonds discussed in the article.
The website managers, its employee(s), and contributors/writers/authors of articles have or may have an outstanding buy or sell position or holding in the securities, options on securities or other related investments of issuers and/or companies discussed therein. The content of the articles and the interpretation of data are solely the personal views of the contributors/writers/authors. Investors must make their own investment decisions based on their specific objectives, resources and only after consulting such independent advisors as may be necessary.